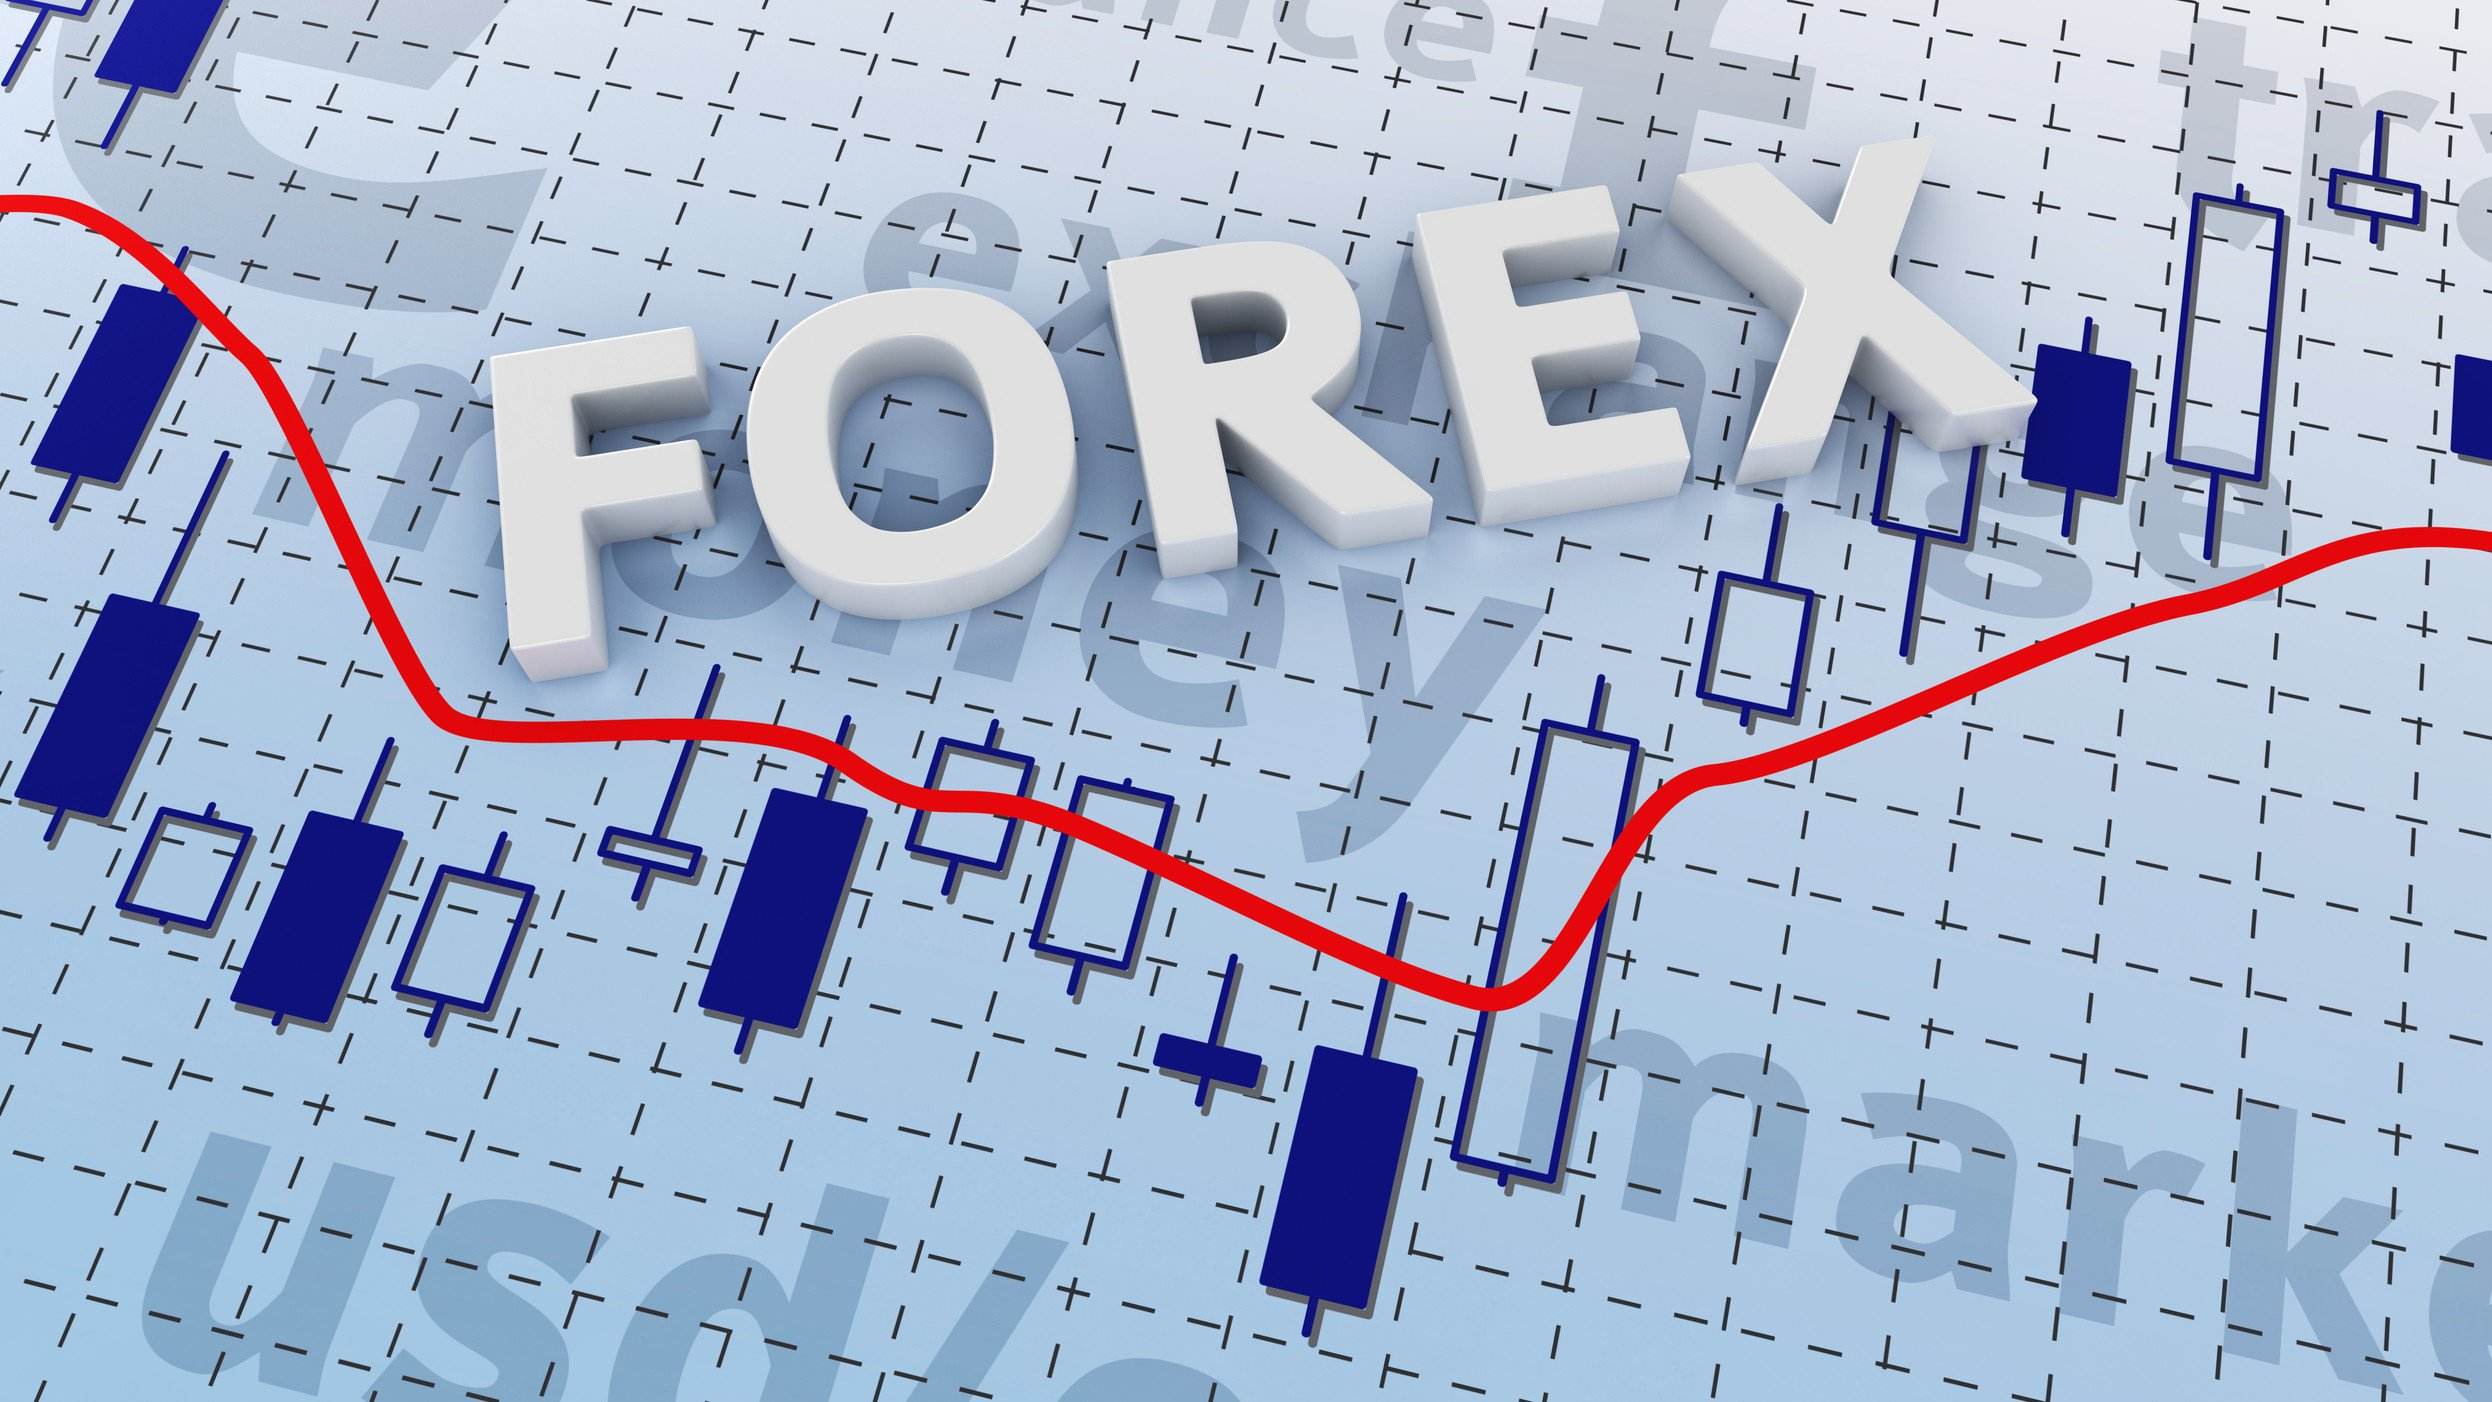
最常用的外汇交易技术分析方法
Moving Average
Moving Average (MA) is one of the most commonly used technical analysis tools in forex trading. It is a trend-following indicator that helps traders identify market trends by smoothing out price data over a specific period of time. The basic concept of MA is to calculate the average price of a currency pair over a chosen number of periods.
There are different types of moving averages, such as Simple Moving Average (SMA) and Exponential Moving Average (EMA). SMA gives equal weight to all periods, while EMA emphasizes recent price data. The choice of which one to use depends on the trader's preference and trading strategy.
Relative Strength Index (RSI)
The Relative Strength Index (RSI) is a momentum oscillator that measures the speed and change of price movements. It is used to identify overbought and oversold conditions in the market. RSI ranges from 0 to 100, with readings above 70 indicating overbought conditions and readings below 30 indicating oversold conditions.
Traders use RSI to generate trading signals. When RSI is above 70, it suggests that the currency pair is overbought, and a price correction or reversal may occur, indicating a potential selling opportunity. Conversely, when RSI is below 30, it indicates that the currency pair is oversold, and a price bounce or reversal may happen, presenting a potential buying opportunity.
Bollinger Bands
Bollinger Bands consist of a simple moving average (usually 20 periods) and two standard deviations above and below the moving average. The bands expand and contract based on market volatility, providing a visual representation of price volatility.
Traders use Bollinger Bands to identify price levels that are overbought or oversold. When the price touches the upper band, it suggests that the currency pair is overbought and may reverse downwards. On the other hand, when the price touches the lower band, it indicates that the currency pair is oversold and may reverse upwards. Bollinger Bands also help traders to identify price breakouts and trend reversals.
Fibonacci Retracement
Fibonacci Retracement is a technical analysis tool based on the Fibonacci sequence. It is used to identify potential support and resistance levels in the market. The key levels generated by Fibonacci retracement are 23.6%, 38.2%, 50%, 61.8%, and 78.6%.
Traders use Fibonacci retracement to determine areas where price corrections or reversals are likely to occur. When the price retraces to one of the Fibonacci levels, it may find support or resistance, leading to a potential reversal or continuation of the trend. Fibonacci retracement can be used in conjunction with other technical analysis tools to confirm trading signals.
Candlestick Patterns
Candlestick patterns are formed by the open, high, low, and close prices of a currency pair within a specific period. They provide valuable information about market sentiment and potential price reversals.
There are numerous candlestick patterns, such as doji, hammer, engulfing, and spinning top. Each pattern has its own interpretation and significance. For example, a doji candlestick indicates indecision in the market, a hammer candlestick suggests a potential bullish reversal, and an engulfing candlestick signifies a possible trend change.
Traders analyze candlestick patterns to identify trading opportunities and make informed decisions. By combining candlestick patterns with other technical analysis tools, traders can improve their accuracy in predicting market movements.
(责任编辑:百科)
-
 Balance of Payments - 国际收支差额国际收支差额(Balance of Payments)是指一个国家与其他国家之间的所有经济交易,包括货物、服
...[详细]
-
 外汇市场开盘和收盘交易时间一览表外汇市场是全球最大的金融市场之一,其24小时交易时间令其与其他金融市场区别开来。在这篇文章中,我们将提供外汇市场开盘和收盘交易时间一览表,其
...[详细]
-
 外汇4小时交易策略介绍外汇四小时交易策略是一种较为常见的交易策略,其核心思想是以4小时级别的K线走势为基础,寻找合适的进场点位,在趋势的大方向上寻求盈利机会。该策略的
...[详细]
-
 外汇是什么?外汇是指不同国家货币之间的兑换和交易,也被称为外汇市场。外汇市场是全球最大、最活跃的金融市场之一。每天交易量高达5万亿美元以上,远超股票和期货市场总
...[详细]
-
 抓住外汇市场的真实趋势外汇市场中的趋势是交易者们所追逐的利润之源,然而,并非所有的趋势都是显而易见的。市场的波动常常受到各种内外因素的影响,从宏观的经
...[详细]
-
 外汇止损怎么做?外汇交易中,止损是一种重要的风险管理工具,它可以帮助交易者最大限度地控制亏损。正确设置止损价位是每个外汇交易者必须要掌握的技能,下面将介绍外汇止损的基本原则和
...[详细]
-
 外汇怎样看盘做分析外汇市场是一个高度信息透明的市场,交易者可以获得大量的市场数据。外汇市场的数据非常复杂,但是只有通过仔细分析这些数据,才能够制定出有效的交易
...[详细]
-
 哪些人适合投资外汇外汇市场具有高流动性、高杠杆和24小时交易等特点,这使外汇市场成为许多投资者的选择。但并不是每个人都适合投资外汇,以下是一些适合投资外汇的人群:
...[详细]
-
 Introduction to DerivativesDerivatives are financial instruments whose value is based on the perform
...[详细]
-
 外汇市场中的八对八错外汇市场作为全球最大的金融市场,每天交易规模巨大,吸引着众多投资者的目光。然而,在外汇交易中存在着一些常见的八对八错,这些错误如果不及时纠正,将会对投资
...[详细]

 Arbitrage - 套利
 外汇为什么会爆仓?怎样防止外汇爆仓?
 外汇知识:外汇市场的功能和作用
 Corridor - 通道
